
Your store generates data with every click, every order, every customer. Here’s how to turn that data into actionable insights.
You’ve built your store. You’ve added products, optimised checkout, set up subscriptions, and secured your site. But how do you know what’s working? Which products are your best‑sellers? Where are your customers coming from? Why are some abandoning their carts?
The answer lies in analytics. In 2026, your reporting tools need to be more than a calculator — they need to be a GPS that guides you toward profit and keeps you out of legal trouble. Relying on gut feeling alone can leave massive growth potential untapped.
In this guide, I’ll cover:
- The built-in WooCommerce Analytics dashboard
- Scheduled Imports – the 2026 performance improvement
- Key reports you should be using: revenue, orders, products, customers, inventory, taxes, coupons
- Extending analytics with plugins
- Google Analytics integration for WooCommerce
- Advanced customer analytics and lifetime value
- The 2026 WooCommerce Insights Report benchmarks
- Weekly and monthly reporting routines
Let’s turn your store’s data into your competitive advantage.
Part 1: The Built-in WooCommerce Analytics Dashboard
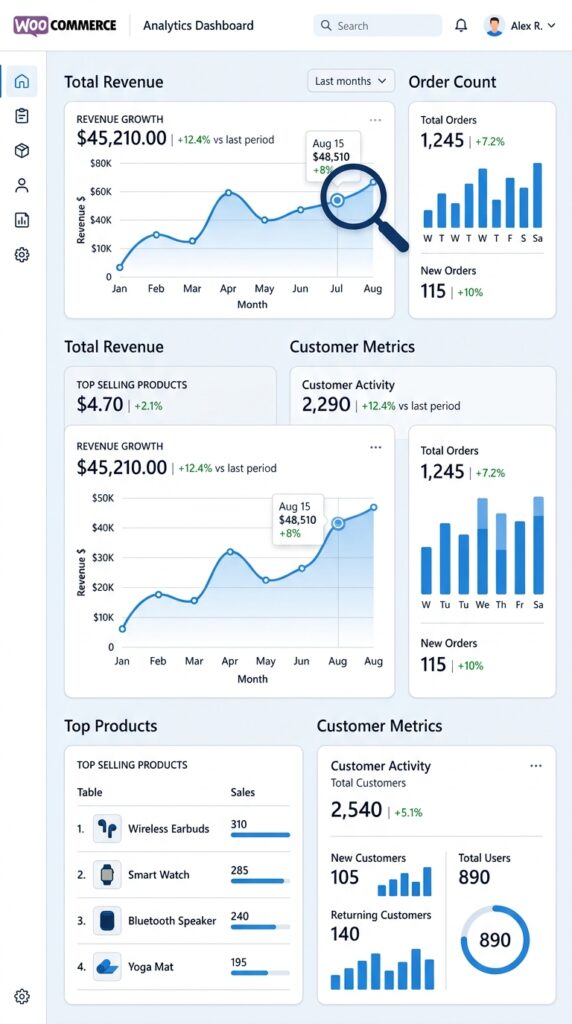
WooCommerce includes a powerful analytics suite right out of the box. You can find it at WooCommerce → Analytics in your WordPress admin.
What’s included
The official analytics area supports dashboard cards, charts, leaderboards, date ranges, and report sections. Here’s what you can track:
| Report Type | What it shows |
|---|---|
| Revenue | Total sales, net revenue, refunds, taxes, shipping |
| Orders | Order count, average order value, order status breakdown |
| Products | Best‑selling products, product categories, stock levels |
| Customers | Customer count, new vs returning, geographic distribution |
| Inventory | Stock levels, low stock alerts, out‑of‑stock items |
| Taxes | Tax collected by rate and by location |
| Coupons | Coupon usage, discount amounts, redemption rates |
Key features of the built-in analytics
| Feature | What it does |
|---|---|
| Date range picker | Compare any period — today, yesterday, this week, last month, custom |
| Dashboard cards | At‑a‑glance KPIs: revenue, orders, average order value, items sold |
| Charts | Visualise revenue and order trends over time |
| Leaderboards | Top products, top customers, top categories |
| Export to CSV | Download report data for offline analysis |
| Order attribution | Advanced reporting on each order’s last‑touch data for all products |
💡 The built‑in analytics are excellent for day‑to‑day monitoring. For advanced reporting, you’ll want to extend with plugins — which we’ll cover in Part 4.
Part 2: Scheduled Imports – The 2026 Performance Breakthrough
If you’ve ever waited for a WooCommerce report to load and watched the screen crawl, you know the pain. In early 2026, WooCommerce completely reimagined how it processes order data for analytics.
What changed in WooCommerce 10.5
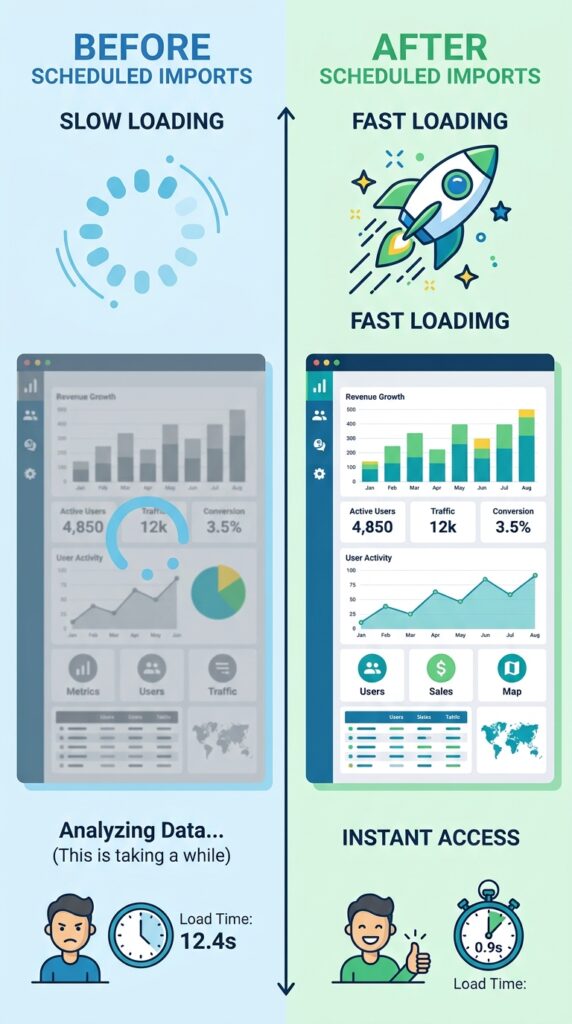
Before: Analytics data was processed order‑by‑order, in real time. For high‑volume stores, this caused database backlogs, slowdowns, and frustrated store owners.
After (WooCommerce 10.5, February 2026): New WooCommerce stores now use Scheduled Imports that batch‑process analytics data every 12 hours, handling 100 orders at a time. This approach dramatically reduces server load while keeping your reports accurate and up‑to‑date.
What this means for you
| Before | After |
|---|---|
| Reports loaded slowly | Reports load quickly |
| Database queries piled up | Batch processing eliminates backlogs |
| High‑volume stores struggled | Stores of all sizes perform well |
| Analytics processing in real time | Analytics processed every 12 hours |
💡 If you’re running an older store (pre‑WooCommerce 10.5), you may not have Scheduled Imports enabled. Check your WooCommerce version and update to benefit from this performance improvement.
| Before | After |
|---|---|
| Reports loaded slowly | Reports load quickly |
| Database queries piled up | Batch processing eliminates backlogs |
| High‑volume stores struggled | Stores of all sizes perform well |
| Analytics processing in real time | Analytics processed every 12 hours |
💡 If you’re running an older store (pre‑WooCommerce 10.5), you may not have Scheduled Imports enabled. Check your WooCommerce version and update to benefit from this performance improvement.
Part 3: Key Reports You Should Be Using
Revenue Report (Analytics → Revenue)
The revenue report shows your store’s financial performance. Key metrics:
- Gross sales – total sales before deductions
- Net revenue – sales minus refunds
- Refunds – amount refunded to customers
- Taxes – tax collected
- Shipping – shipping revenue
Why it matters: This is your store’s health check. Monitor net revenue trends weekly. A sudden drop might indicate a technical issue, a competitor’s promotion, or seasonal slowdown.
Orders Report (Analytics → Orders)
The orders report breaks down your order volume and behaviour:
- Order count – total orders in the period
- Average order value (AOV) – average revenue per order
- Order status breakdown – pending, processing, completed, cancelled, refunded
Why it matters: AOV is a key metric for measuring upsell and cross‑sell effectiveness. If AOV is flat or declining, you may need to revisit your product recommendations or pricing strategy.
Products Report (Analytics → Products)
The products report identifies your best‑ and worst‑performing products:
- Items sold – quantity sold
- Net sales – revenue per product
- Orders – number of orders containing this product
- Stock – current inventory level
Why it matters: Focus your marketing budget on your top products. Identify slow‑moving inventory that may need discounting. Use product performance data to plan new product development.
Customers Report (Analytics → Customers)
The customers report provides insights into your customer base:
- Customer count – total unique customers
- New vs returning – first‑time buyers vs repeat customers
- Geographic distribution – where your customers are located
- Average order value – per customer
- Lifetime value – total spend per customer
Why it matters: The new vs returning ratio tells you if your retention strategies are working. A declining return rate suggests you need to improve post‑purchase engagement.
Inventory Report (Analytics → Inventory)
The inventory report helps you manage stock:
- Stock levels – current inventory for each product
- Low stock – products below threshold
- Out of stock – products with zero stock
Why it matters: Running out of stock means lost sales. The inventory report helps you reorder before it’s too late.
Coupons Report (Analytics → Coupons)
The coupons report tracks discount code performance:
- Coupon usage – how many times each coupon was used
- Discount amount – total discount given
- Sales generated – revenue from orders using the coupon
Why it matters: Not all coupons are created equal. This report helps you identify which promotions actually drive profitable sales versus which ones just eat into your margin.
Part 4: Extending Analytics with Plugins
The built‑in analytics are solid, but they have limitations. For example, built‑in analytics in WooCommerce core does not include metrics like add‑to‑cart events, cart abandonment, and conversion rates. That’s where analytics plugins come in.
Best WooCommerce analytics plugins for 2026
| Plugin | Best for | Key features |
|---|---|---|
| Alpha Insights | Profit reporting and cost of goods | COGS management, Google Analytics‑style traffic analysis, drag‑and‑drop report builder |
| MarginMinds | Free core analytics | Customer lifetime value (CLV), refund rate, net profit, repeat vs new customer ratio |
| InsightPress | Visual analytics | Revenue, product insights, traffic attribution, cart abandonment |
| 360 Analytics | KPI dashboard | Total Revenue, Lifetime Revenue, Orders Count, Items Sold, AOV, interactive sales line chart |
| CommerScope | Funnel analytics | Product Views → Cart Additions → Checkout Starts → Completed Purchases |
| Sales Analytics | Custom reports | View analytics by payment method, detailed product analytics, export CSV or PDF, Charts.js visualisation |
| Fullmetrix | Marketing analytics | Orders, customers, products, categories, coupons, refunds, subscription data |
| Advanced Customer Reports | Customer‑focused analytics | Total orders, order averages, recent orders list, recent activity, product totals, coupons used |
My recommendation
Start with Alpha Insights if you need profit tracking and cost of goods management — essential for understanding true profitability.
Start with MarginMinds if you want a free, lightweight analytics plugin that covers the essentials.
Start with CommerScope if you’re struggling with cart abandonment — its funnel analytics show exactly where customers drop off.
💡 Most analytics plugins are free to start. Install one, explore the dashboards, and upgrade to a paid version only if you need advanced features.
Part 5: Google Analytics Integration for WooCommerce
While WooCommerce’s built‑in analytics track store‑specific metrics, Google Analytics tracks visitor behaviour — where they come from, what they do on your site, and how they interact with your store.
What Google Analytics adds
| Metric | What it tracks |
|---|---|
| Traffic sources | Where visitors come from (Google, social, direct, referral) |
| Add‑to‑cart events | Which products are added to carts |
| Checkout behaviour | Where customers drop off in the checkout process |
| Conversion rate | % of visitors who complete a purchase |
| Bounce rate | % of visitors who leave after one page |
Best plugins for Google Analytics integration
| Plugin | Key features |
|---|---|
| Google Analytics for WooCommerce (official) | Official WooCommerce plugin, referral to purchase linking, transaction data |
| GIA GA4 | Full recommended ecommerce funnel, line‑item enrichment, server‑side purchase backup, consent‑aware |
| Pixel Manager for WooCommerce | Google Ads, GA4, Meta/Facebook Pixel, TikTok Pixel — all in one |
| Trackify | Connect to GA4 in under two minutes |
| Datalayer for WooCommerce | For Google Tag Manager users — advanced ecommerce activities |
Setting up Google Analytics for WooCommerce
- Create a Google Analytics 4 property (free).
- Install the Google Analytics for WooCommerce plugin (or your chosen plugin).
- Enter your Measurement ID (starts with
G-) in the plugin settings. - Enable e‑commerce tracking and purchase events.
- Wait 24‑48 hours for data to appear.
💡 For the most complete tracking, consider using the Pixel Manager for WooCommerce — it handles multiple platforms from one interface.
Part 6: Customer Analytics – Beyond Basic Reports
Understanding your customers is the key to growth. WooCommerce offers a dedicated Customer Analytics extension that provides advanced customer metrics and insights beyond standard WooCommerce reporting.
What customer analytics reveals
| Metric | What it tells you |
|---|---|
| Customer lifetime value (CLV) | Total revenue expected from a customer |
| Repeat purchase rate | % of customers who buy again |
| Churn rate | % of customers who stop buying |
| Geographic sales distribution | Where your customers are located |
| First‑time vs returning | Acquisition vs retention balance |
Calculating CLV (simple method)
text
CLV = Average Order Value × Purchase Frequency × Customer Lifespan
| Component | How to find it |
|---|---|
| Average Order Value | Total revenue ÷ Number of orders |
| Purchase Frequency | Total orders ÷ Unique customers |
| Customer Lifespan | Average months a customer stays active |
💡 A store with customers who buy twice and spend $100 each time has a CLV of $200. A store with customers who buy five times and spend $100 each time has a CLV of $500. The difference is retention.
Part 7: The 2026 WooCommerce Insights Report – Benchmarks for Your Store
The 2026 edition of the Metorik Insights for WooCommerce report is built from over 65 million orders totaling more than $6.6 billion in revenue, from a randomised sample of 6,000+ WooCommerce stores. This isn’t survey data or opinion — it’s real order data.
Key benchmarks from 65 million orders
While the full report contains extensive data, here are the key takeaways for store owners:
| Benchmark | What to track |
|---|---|
| Average order value (AOV) | Compare your AOV to industry averages |
| Repeat purchase rate | How many customers come back |
| Revenue per customer | Total revenue ÷ total customers |
| Product performance | Which categories and products drive revenue |
Why this matters: Benchmarks tell you if you’re underperforming or overperforming compared to similar stores. If your AOV is below the benchmark, you may need to improve your upsell and cross‑sell strategy. If your repeat purchase rate is below benchmark, focus on retention.
💡 The full Metorik Insights Report is available at metorik.com. It’s free to access and provides valuable benchmarks for your store.
Part 8: Weekly and Monthly Reporting Routines
Analytics is only useful if you act on it. Here’s a simple reporting routine to keep your store on track.
Weekly check (15 minutes)
| Task | What to look for |
|---|---|
| Check revenue vs previous week | Is revenue growing or declining? |
| Review top products | Which products are selling? Any surprises? |
| Check inventory | Any low‑stock or out‑of‑stock products? |
| Review coupon usage | Which coupons are being used? |
| Check order statuses | Any pending or failed orders needing attention? |
Monthly check (30 minutes)
| Task | What to look for |
|---|---|
| Compare month‑over‑month | Revenue, orders, AOV trends |
| Review new vs returning customers | Is retention improving? |
| Check customer lifetime value | Is CLV increasing? |
| Review product performance | Which products are declining? |
| Analyse traffic sources | Where are customers coming from? |
| Check refund rate | Is it increasing? Why? |
Quarterly check (1 hour)
| Task | What to look for |
|---|---|
| Year‑over‑year comparison | How does this quarter compare to last year? |
| Review customer segments | Which segments are most profitable? |
| Analyse seasonal patterns | Are there predictable peaks and troughs? |
| Set targets for next quarter | Revenue, AOV, retention goals |
What’s Next?
You now have a complete analytics system for your WooCommerce store. You can track revenue, orders, products, customers, inventory, and traffic — and use that data to make smarter decisions.
👉 Next article in this series: WooCommerce Extensions & Ecosystem – Taking Your Store Further
We’ll cover the best WooCommerce extensions for shipping, tax automation, accounting integration, customer reviews, and more.
What’s your biggest analytics challenge? Are you using the built‑in reports or a plugin? Let me know in the comments.
📌 Key Takeaways (for skimmers)
- Built‑in WooCommerce Analytics (WooCommerce → Analytics) covers revenue, orders, products, customers, inventory, taxes, and coupons.
- WooCommerce 10.5 introduced Scheduled Imports — batch‑processing analytics data every 12 hours, dramatically improving performance for high‑volume stores.
- Key reports: Revenue (financial health), Orders (volume and AOV), Products (best‑sellers), Customers (new vs returning), Inventory (stock management), Coupons (discount performance).
- Extend analytics with plugins: Alpha Insights (profit + COGS), MarginMinds (free core), InsightPress (visual analytics), CommerScope (funnel analytics).
- Google Analytics integration adds traffic sources, add‑to‑cart events, checkout behaviour, and conversion rates.
- Customer Lifetime Value (CLV) is the most important customer metric — calculate it and track it monthly.
- The 2026 WooCommerce Insights Report analysed 65 million orders ($6.6B revenue) — use it for benchmarks.
- Weekly and monthly reporting routines turn data into action.
🔗 Internal Links
- Article #1 – WooCommerce in 2026 – Market Share & Trends
- Article #2 – Installing WooCommerce & Setup Wizard
- Article #3 – Adding Your First Product
- Article #4 – License Keys for WooCommerce
- Article #5 – Optimising Checkout for Digital Products
- Article #6 – Abandoned Cart Recovery
- Article #7 – Managing Orders & Customers with HPOS
- Article #8 – Marketing & Promotions
- Article #9 – Recurring Revenue & Subscriptions
- Article #10 – Google Listings & Ads for WooCommerce
- Article #11 – Customer Retention & Loyalty Programs
- Article #12 – WooCommerce Security & Performance
- You are here – WooCommerce Analytics & Reporting
- Article #14 – WooCommerce Extensions & Ecosystem (coming soon)